K-means algorithm
Hi there and welcome back to another tuto of this serie on the 10 basics algorithm to know in machine learning ^^
Today, we're going to focus on K-means clustering and see why this rather simple algorithm is so popular among the machine learning community to perform simple task
such image segmentation, trend analysis on dynamic data or document clustering. However, before going further in its implementation and try our hand with real life examples , as always let's make
a quick recap of the theory behind this algorithm ^^
Theory
Usually, unsupervised algorithms make inferences from dataset using only input vectors without referring to known or labelled outcomes. In the case of K-means
though the process is a bit different. Indeed, here the idea is to simply groups similar data points together given a fixed number (k) of clusters in a dataset and from there discover underlying
patterns.
Reminder
=> A cluster refers to a collection of data points aggregated together because of certain similarities
K-means process
We define a target number k, wich refers to the number of centrois we need in the dataset. Then, once we have our set of centroids, we allocate every data point to
each of the clusters through reducing the incluster sum of squares.In other words, the K-means algorithm identifies k number of centroids, and then allocate every data point to the nearest
cluster, while keeping the centroids as small as possible.
Reminder :
=> A centroid is the imaginary or real location representing the center of the cluster.
How the K-means algorithm works
To process the learning data, the K-means algorithm in data mining starts with a first group of randomly selected centroids, which are used as the beginning points
for every cluster, and then performs iterative calculations to optimize the positions of the centroids.
It halts creating and optimizing clusters when either:
- The centroids have stabilized - there is no change in their values because the clustering has been successful
- The defined number of iterations has been achieved
Application
In order to illustrate the K-means clustering algorithm we will do two examples. The first one, will be very basic and present a textbook example then in the second
one we'll try our hand on the handwritten digits database and use the K-means on it.
Application 1
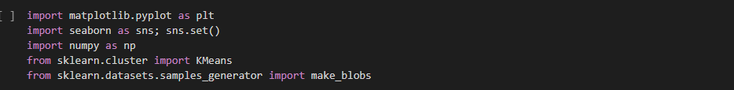
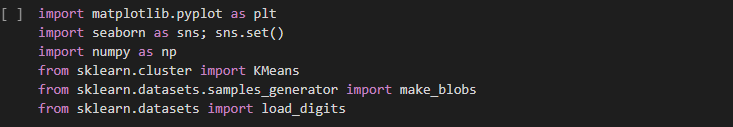
First thing first let's import the needed libraries :
Once it's done we need to import our data from the preload dataset from our library :

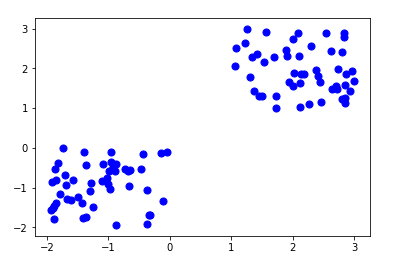
Let's now take a look at our data :
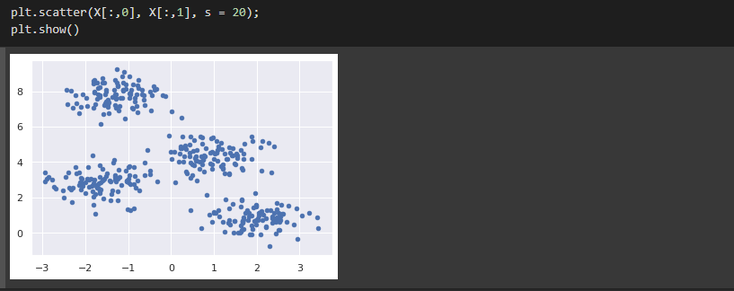
As you can see, here a good guess for the number of clusters seems to be 4, so let's create and fit our model accordingly.

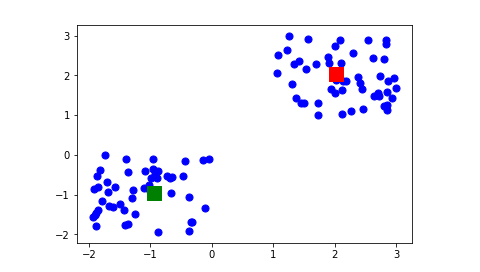
Once it's done the only thing remaining to do is to use our model to make our predictions and plot our results :

And that's it for our basic illustration.
Application 2
As in our first exemple, we first have to import the needed libraries :
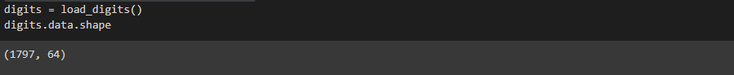
Once it's done we import our preload dataset of handwritten digits and check it's shape to make sure that everything is set up correctly
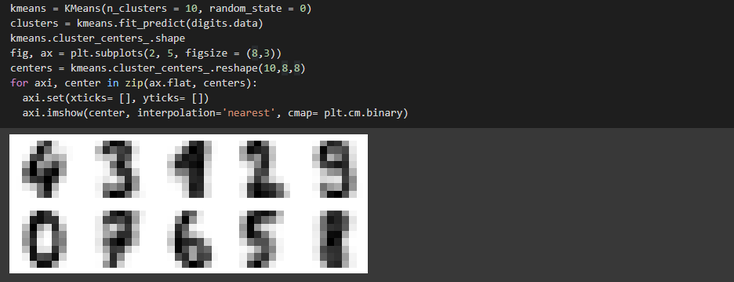
From there we build our model with a k number equals to 10 given that our database contains images of handwritten digits from 0 to 9 and plot our cluster centers in order to check that the model is not going haywire and that each centroids is indeed corresponding to a number between 0 and 9
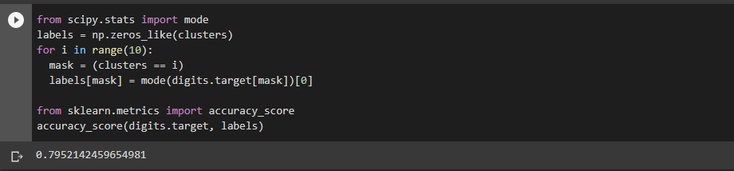
Finally, we match the learned cluster labels with the true labels found in them and check the accuracy of our model as follows :
And that's it for this little bit more realistic application on a real word dataset. So as always these applications being fairly simple and basic do not hesitate
to go beyond and use this algorithm on more complex problems with bigger dataset in order to get a deeper understanding of it.
As always full code for this tuto can be found here
I'll catch you on the next tutorial, in the meantime happy coding (peace sign)

All information/documents contained in this website rely solely on my personal beliefs, and do not constitute professional investment advice.
Be careful in your investment and do not invest more than you can afford to loose.
Contact :
e-mail: christophe.richon.pro@gmail.com