
Statement analysis ( Part 1 )
Financial statement analysis is one of the pillar of financial analysis and one the main of the tool allowing analysts to spot the weaknesses and strength of a
businesses in order to build an efficient mid/long term investment strategies.
In this tutorial build in two parts we will at first do a standard financial analysis based on the Ford Motor company over the period 2016-2019 by identifying and
discussing the liquidity, debt, activity & profitability levels then in a second tutorial we will see how we can automate all this process through the use of VBA.
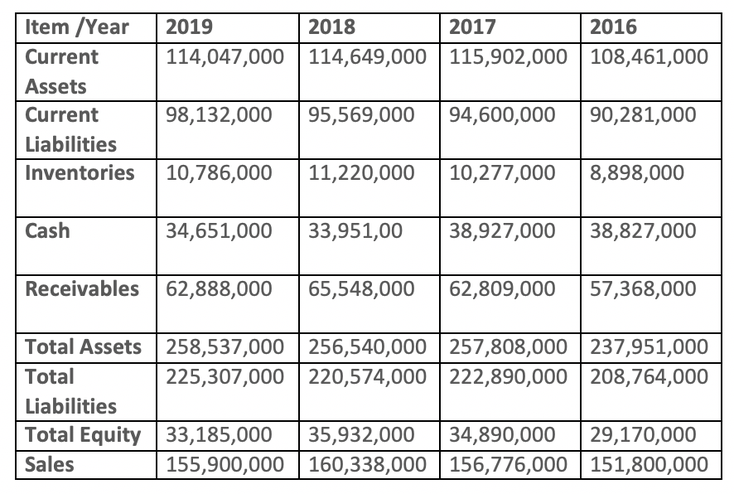
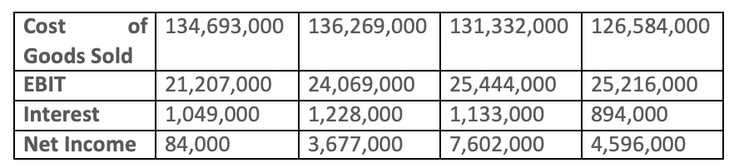
Data and Methodology
In order to keep things simple and to make sure that everyone can reenact this tutorial on its own we will use the Yahoo Finance which allows us to get a quick and
simple access to the annual financial statements of most existing businesses.
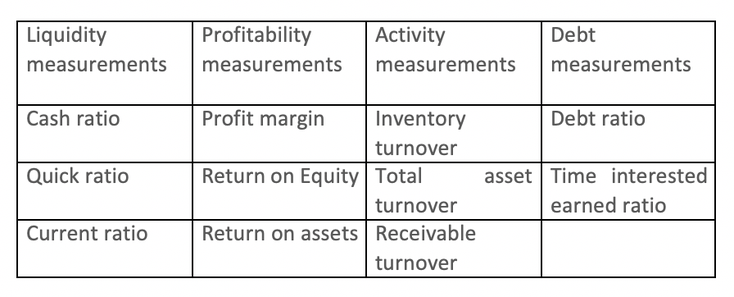
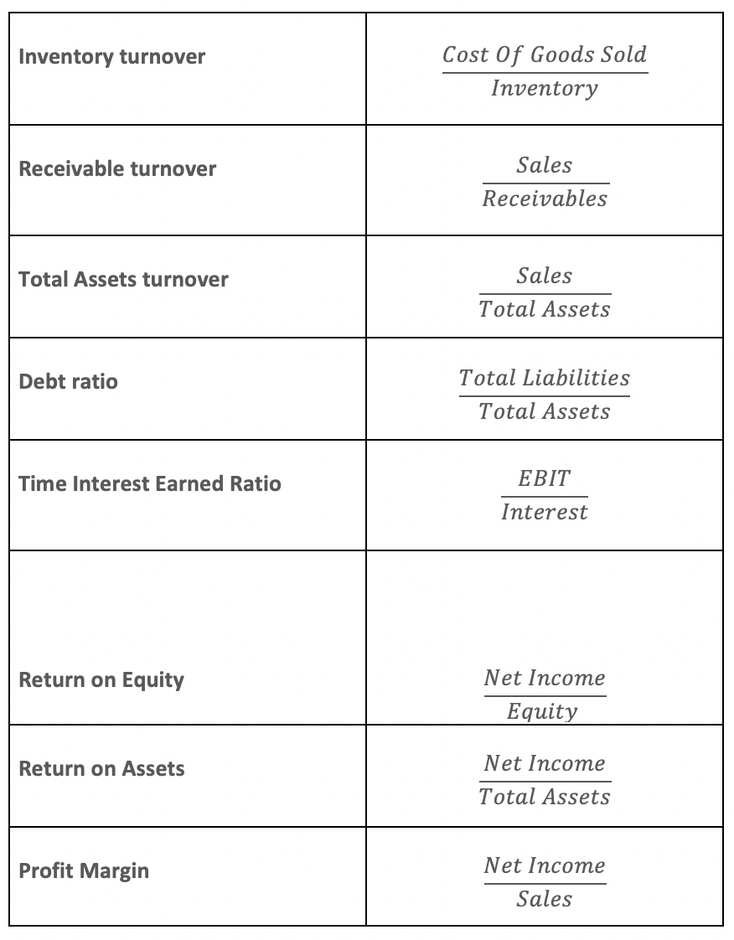
On the methodology side, we will here use the following measurements in order to analyze the liquidity, debt, activity and profitability levels :
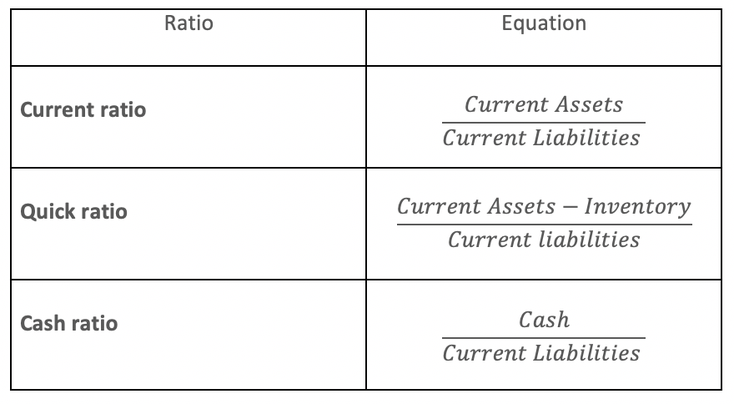
Quick reminder :
Results
Liquidity Measurements
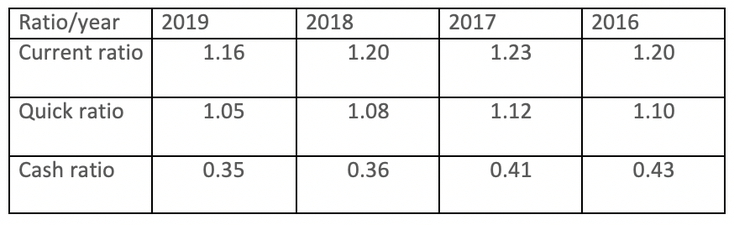
Starting off with Ford’s liquidity measurements the current ratio measuring the ability to pay short-term debts with the short-term assets available shows us that
for the period 2016-2019, Ford was able to cover its current debt by approximately 1.2 times each year even though we can notice a decreased of 0.04 for 2019 suggesting that the company might
have increased its current liabilities over its current assets or suffer a decrease of its short-term assets.
Moving on to the quick ratio measuring the company’s ability to cover its short-term debts from its current assets without having to sell its inventory, we can
notice that its value is above the acceptable value of 1 over the whole period proving. As such we can assess that the company exhibit a positive liquidity situation over the period.
Finally, by analyzing the cash-ratio measuring the company’s ability of paying short-term debt with only the highest form of liquid current assets (cash & cash
equivalent) we can notice that the ratio value for the entire period is far beyond the acceptable value of 1 and exhibiting a downward trend indicating an inability for Ford to support all its
current obligations by its sole cash position. However, is not specially worrying given the specifity of the auto industry and the cash ratio value exhibited by Ford’s main competitors
worldwide.
Activity measurements
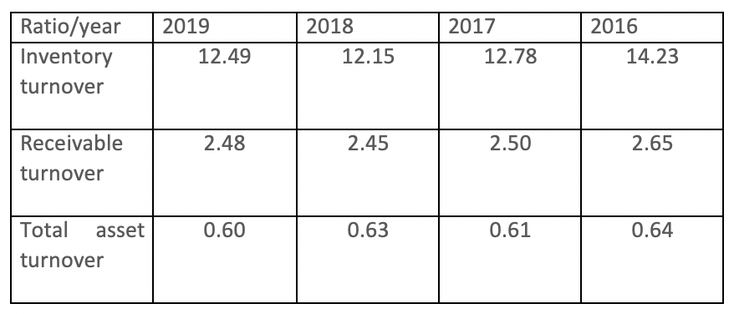
Let’s aboard the activity measurement by first taking a look at the inventory turnover ratio representing the company’s sales rate of stocked goods over the cost of their post-sale replacements. As we can see, Ford’s turnover ratio over the four years oscillates between 12-14 indicating a high rate of sales and fast post-sale inventory purchases to satisfy customer quickly without any delays. Furthermore, the recent increase in 2019 following the continuous downtrend from 2016 to 2018 means that either sales have recently increased or that the company recently reduced its stocked inventory.
Now, looking at the receivable turnover which determines how well the company collects owed revenue from sales by customers we can notice that Ford exhibit a
pretty high ratio of approximately 2.5 for the period meaning that the company is able to collect their receivable fairly easily. Nonetheless, the downward trend of the ratio value on the period
must be not be overlooked as it can mean that either the company is suffering from a weakening of its collection. Mechanism or started to engage with customers exhibiting weaker credit
scores.
Lastly the total asset turnover representing how the firm turns over its sales per year using its total asset is averaging around a value of 0.6 which for the
auto industry is pretty high considering that those companies cannot utilize their assets to generate sales as often as other sectors. However, given the downtrend shown over the period it is
important to keep an eye on its future evolution in order to factor in a potential growing inefficient asset utilization process.
Debt measurements
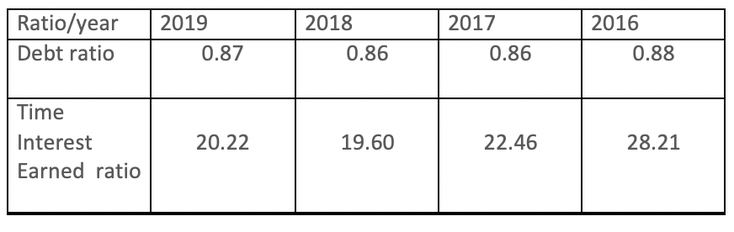
Shifting to the debt measurements, we can see that over the period, the debt ratio reporting the financial status of the company appears to be pretty good for the auto industry sector even though its value is way above the recommended value of 0.5. Furthermore, the small decline on the period, shows that the company decrease its funding through liabilities over the period.
Looking at the times interest earned ration measuring Ford’s ability to pay its interest and other obligations considering its earning before tax & income
expenses (EBIT) we can see that its value is way above the recommended value of 1 proof of a sound financial situation. Nonetheless, the decrease, of the ratio over the period need further
investigations in order to determine if it was mainly due to an increase in the obligations or a decrease of the EBIT.
Profitability measurements
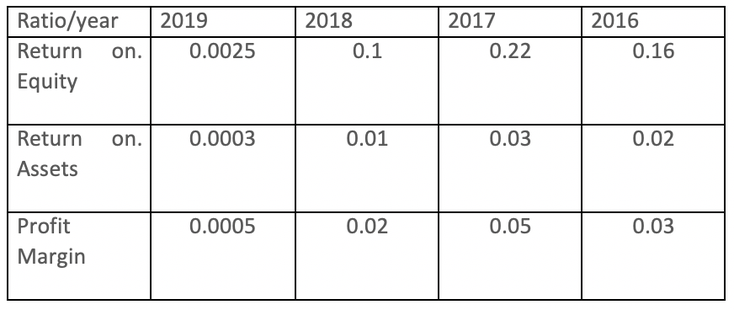
Lastly let’s check the profitability measurement. Starting by looking at the return on equity (ROE) which measures the company ability to pay investors from
leftover income after paying all the other expenses, we can note that over the period, Ford exhibit a ROE of more than 10% except for 2019 which is acceptable given the convergence issues
suffered by the auto industry during this last year. However, the decrease on the period 2017-2018 prior to the convergence issue could signals the pursuit of a poor reinvestment strategy in
unprofitable assets and definitely calls for further investigation in order to get a clear picture of the company situation.
Moving on to the return on assets (ROA) depicting the firm cost-effectiveness level of scarce resource management, we can note a downward trend for the whole period
proof of an ineffective asset management during those four years.
Finally, when analyzing the profit margin which defines the how much profit in percentage is gained from a dollar of revenue we can see that value are globally on
par with the low profit margin value characteristic of the auto industry. Nonetheless, we can notice a down downward trend over the period which could be explained by higher expenses costs, sales
decrease or lower annual revenues.
And that’s if for this first part of this two part tutorial. So don’t hesitate to go through it again or to try to perform the analysis for another company in the
auto industry to compare with the result of Ford. The second part, focused on the automation of this analysis process is in the making and should come shortly so stay tuned.
See you on the next one !

All information/documents contained in this website rely solely on my personal beliefs, and do not constitute professional investment advice.
Be careful in your investment and do not invest more than you can afford to loose.
Contact :
e-mail: christophe.richon.pro@gmail.com