
Bitcoin trading algorithm part 1
Hi there !
As you may have noticed by browsing through the website, I'm quite interested by the crypto space 😄 that's why I thought that it would be cool to create as our first trading algorithm a bitcoin trading algorithm. So if it suits you, let's give it a try !
As usual, you'll find the full code here
1. The strategy
Given the fact that it is our first trading algorithm we will try to keep things simple here, especially as I'm not quite sure that the btc market is currently mature enough to be modelise through complex model such as Convolutional Neural Network (CNN) or other fancy modelling.
In this sense, we will here based our strategy on the one display in the following research paper which I really encourage you to read in its entirety to get a better understanding of the strategy (click here), however, if you don't want to or don't have access to it, here's a quick recap :
Strategy recap :
Idea :
- We use the volume of Wikipedia and Google Trends search terms linked to bitcoin to generate trade signals for buying or selling.
Methodology :
- We compute the median with a rolling window of 28 days for each term then we calculate the change in the rolling 28 day median for each trading day and consider it as a buy signal if it positive or null and a sell signal in the opposite case.
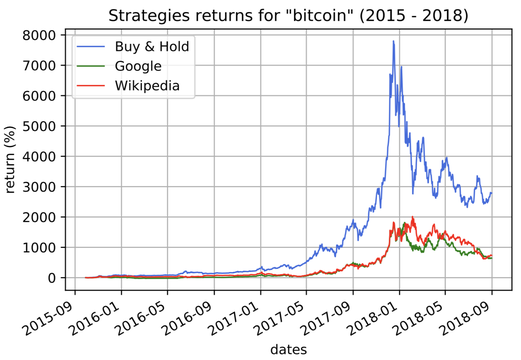
- Once we have those signals, we compute the cumulative return of our strategy in each case and compare it to the basic buy & hold strategy.
Data :
Used set of words :
- Bitcoin, Cryptocurrency, Blockchain ( related crypto keywords )
- Happiness, Psychology, Big Data ( random keywords to check if our strategies return are not due to luck )
To get our daily data, we use :
- For Wikipedia : http://tools.wmflabs.org/pageviews
- For Google Trends : the pytrends library
Period : In this tuto due to the problem of data availability we will focus on the period 2015/09/01 - 2018/09/01
2. The algorithm
In order to code our algorithm we first need to extract our data from Google Trend and Wikipedia. For Wikipedia, we don't really have any problem as we can download CSV files of research term daily volume back to our startdate.

However, for Google Trends, things are not as simple. Indeed, there is no API for Google Trends and the website only allows us to get daily data for the last 90 days which is quite problematic in our case.
So, to get around this problematic we're going to use the pytrends library which acts as a pseudo API for Google trends and create a function extracting the daily data for the whole period by segmenting it in windows of 90 days.
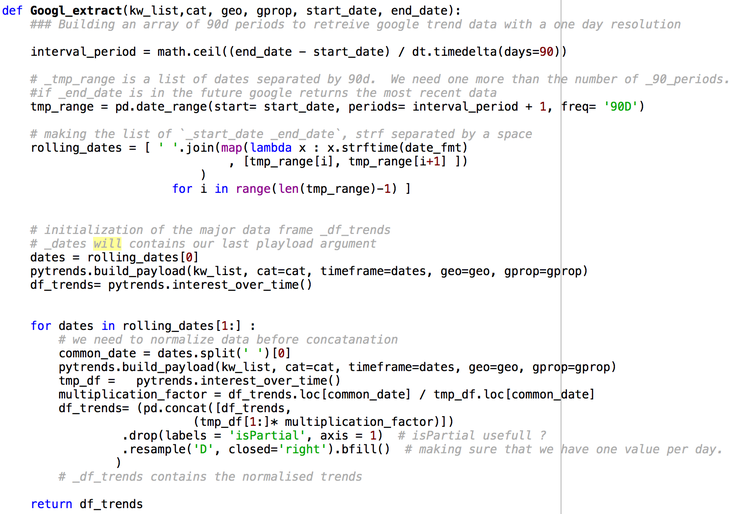
If you want to see the whole code in order to get the data into clean dataframes go see the full code ☞ here
Now, let's approach our strategy. As you can see in the little recap above we have to perform mainly 3 tasks :
- Compute the rolling median with a window of 28 days for each research term
- Compute the variation of each median on the period and extract the corresponding selling and buying signals
- Compute the cumulative return of our strategy for each research term
So first, let's see how do we compute the rolling median. This part is pretty simple, indeed, we just need to our respective dataframes with the wikipedia data and the google data and apply simultaneously on it the rolling function already implemented in Python and the median function as follows:
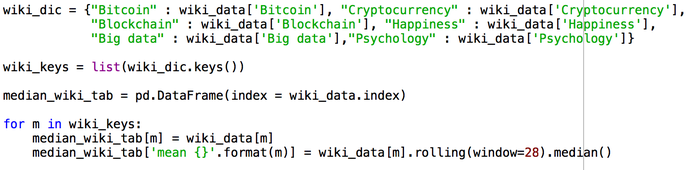
(note : Here to be more efficient, what we do is that we stock in the wiki_dic dictionnary all the data of our wikipedia dataframe and then used a for loop in order to create directly the median_tab dataframe which compiles at the same time the wikipedia data and the 28 days rolling median for each research term. )
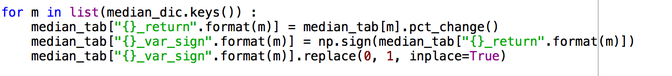
Once we have the rolling median for our research term, we have to get our buy and sell signals. To do so, the easiest way is to merge our two dataframes containing our wikipedia and google data into one dataframe, use the pct_change function on each column and then associate each positive variations to 1 and each negative ones to -1 as follows :
Now, in order to get the return for each day of our period we apply our return formula as defined in the research paper :
Strategy Return t = signal t - 1 x R t
with :
- R t : the BTC price return for day t
- signal t - 1 equals to 1 ( long ) or -1 ( short )
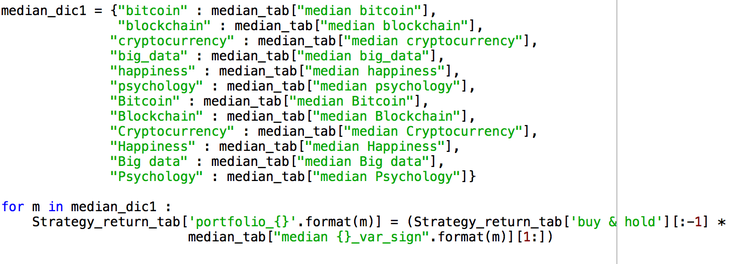
Then once we have our daily return the only thing left remaining is to compile the cumulative returns as follows :

And that's it ! We have our bitcoin trading algorithm. However, as you will see if you run the code this latter perform pretty poorly by comparison with the Buy & Hold strategy. So it would be interesting to see in further developments if the choice we made to consider a null variation as a buy signal is a big factor in explaining the difference between our results and the results obtained in the research paper.
Have a good day and happy trading ! 🙂

All information/documents contained in this website rely solely on my personal beliefs, and do not constitute professional investment advice.
Be careful in your investment and do not invest more than you can afford to loose.
Contact :
e-mail: christophe.richon.pro@gmail.com