
Technical analysis introduction
Hi, today we're gonna approach some of the basic technical indicators that are used on the crypto market to try to forecast the fluctuation of the price of cryptocurrencies. Ready ? Let's do it !
First to get our data we will have to download them from a broker. However, here, in order to keep things simple we will use Yahoo data and extract them using the following code :
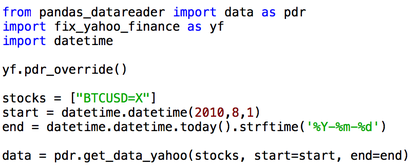
If you don't want to use data from Yahoo since its not very specialized in cryptocurrency I recommend you to use the Poloniex API which is very well explained here and gives you an easy and relatively free access to the data of one the biggest exchange in the crypto market.
Example of code using Poloniex API to get historical data :

Now, that we have our data ready to use, let's start coding our basic technical indicators !
Our goal here is to make a little introduction so we will focus only on the following indicators :
- the (academic/ trading / Parkinson / Garman Klass) volatility
- the Simple Moving Average (SMA)
- the Bollinger bands
- the commodity channel index ( CCI )
However, I encourage you to go beyond and code other common indicators like the MACD or RSI in order to get a broader understanding of the technical analysis field 😉
1. The volatility :
If you want a little recap on the notion volatility you can go here
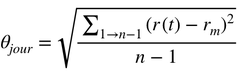
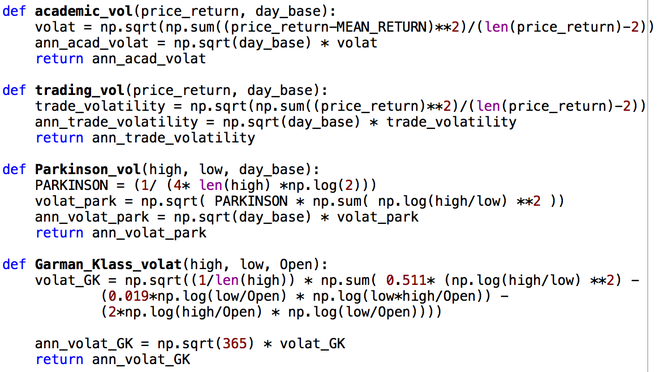
Academic volatility :
with :
- rm the mean value of the returns computed on [t-1, t]
- r(t) : the return on [ t- 1, t]
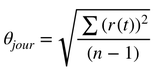
Trade volatility :
with :
- r(t) : the return on the period [ t - 1, t ]
Parkinson volatility :

with :
- n : the number of days
- Hi : the high of the day
- Li : the low of the day
Garman - Klass volatility :

with :
- Oi : the opening price on day i
- Ci : the closing price on day i
- Hi : the high on day i
- Li : the low on day i
Here the best way to code these formulas is to code them as functions in order to be able to easily reuse them whenever we need :
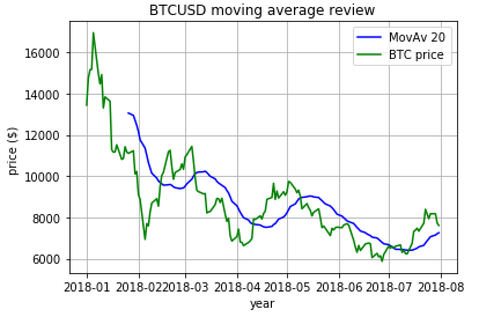
Now that we have code our different types of volatility let's see the simple moving average.
2 The simple moving average
The moving average is a widely used indicator in technical analysis that helps smooth out price action by filtering out the noise from random price fluctuations. However, it is important to bear in mind that it is a trend following or lagging indicator due to the fact that it's based on past prices.
Thankfully the combination of the rolling and mean function already implemented in python allows us to directly calculate the moving average. In this sense, we just have to create a function of the following form to be able to compute the MA for any rolling window of our choice (20 days, 50 days, etc ) :

3. The Bollinger Bands
The Bollinger Bands are volatility bands placed above and below a moving average which respectively widen or narrow when volatility increases or decreases. In this sense, thanks to this dynamic nature we can easily used them on numerous securities to get an idea of the trend strength.
Bollinger bands formula :
- Middle Band = 20-day SMA
- Upper Band = 20-day SMA + (20-day standard deviation of price x 2)
- Lower Band = 20-day SMA - (20-day standard deviation of price x 2)
Here instead of using a formula due to the fact that the Bollinger Bands have to be represented to help us in our technical analysis it's better to directly calculate the variables and plot them instead of creating a function :

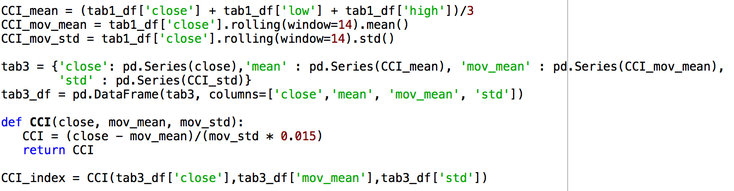
4. The Commodity Channel Index ( CCI )
The CCI measures the current price level relative to an average price level over a given period of time. Usually, CCI is relatively high when prices are far above their average and relatively low when they are far above this is why this indicator is commonly used by investor as a signal for overbought and oversold levels.
CCI formula :
- CCI = (Typical price - 20-day SMA of Typical price) / (0.015 * Mean Deviation )
- Typical Price = (High + Low + Close) / 3
Due to the fact that what's really import here is the graphical representation of the CCI the best is to define the CCI trough a function and then implement our CCI values into a dataframe in order to plot easily our CCI :

And we're done ! We have all our indicators !
Now, as said earlier these indicators are basic and in any case sufficient to perform a good technical analysis. Indeed, if you want to perform such analysis you'll have to couple these indicators with more advanced indicators and informations on the asset or sector that you wish to invest in and remember never invest more than you're willing to loose.
Have a good day ! 😃
Full code : here

All information/documents contained in this website rely solely on my personal beliefs, and do not constitute professional investment advice.
Be careful in your investment and do not invest more than you can afford to loose.
Contact :
e-mail: christophe.richon.pro@gmail.com